


|
Socoder -> JSE -> Optimisationalism 6 |
|
| Tue, 02 Sep 2025, 03:51 | |
|
Jayenkai |
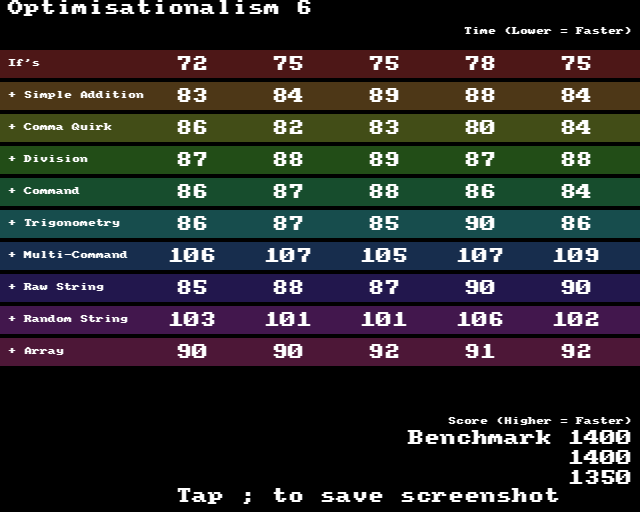
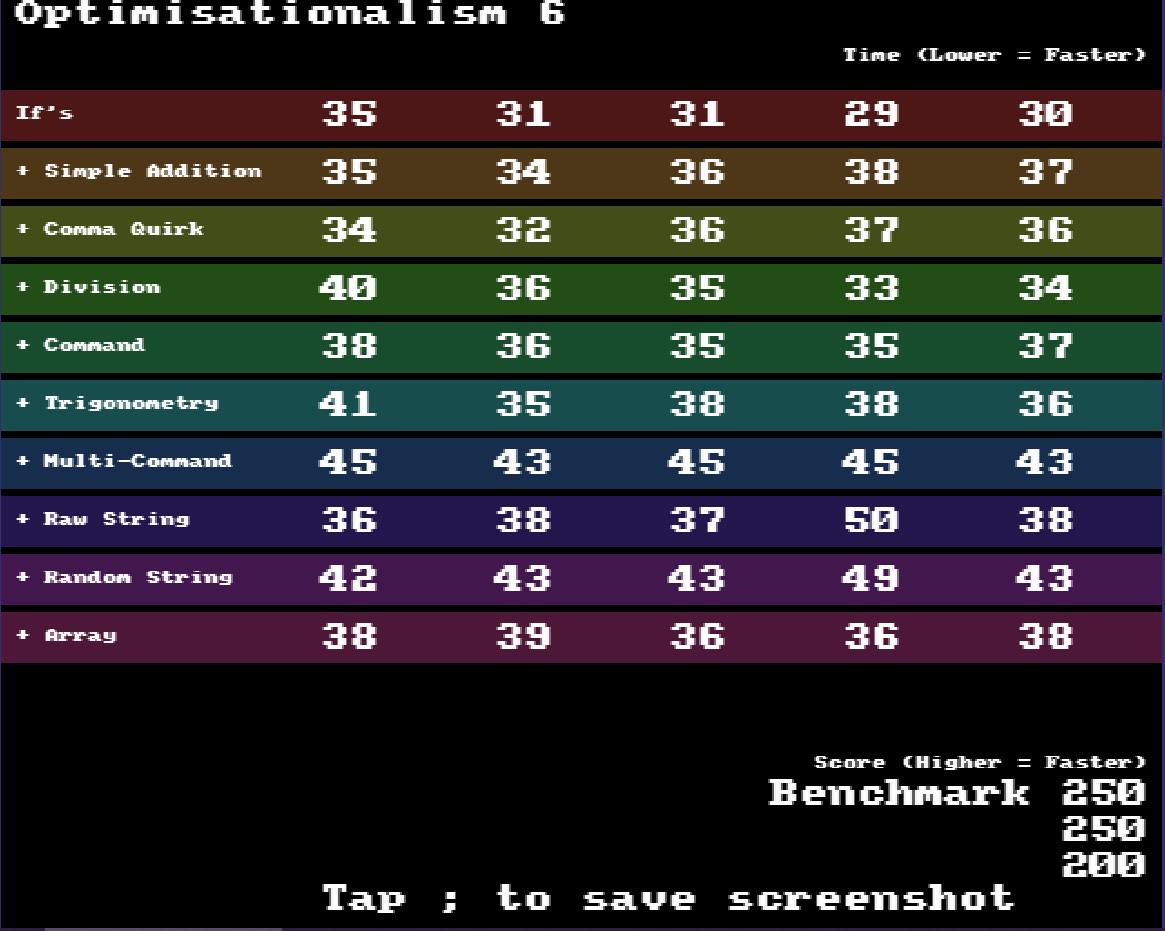
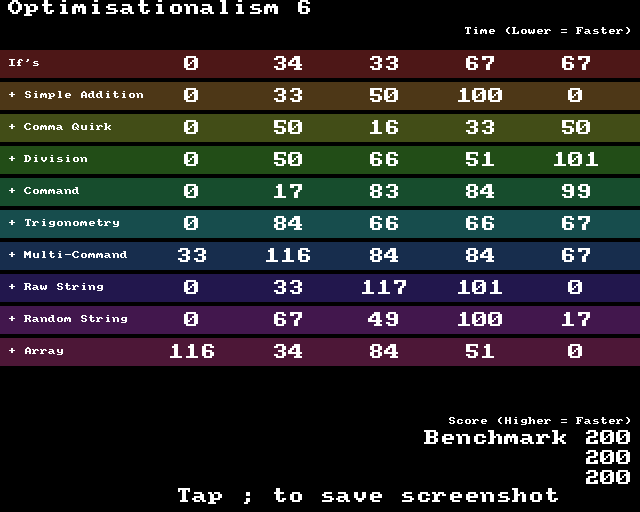
Optimisationalism 6Time for some hardcore Optimisaling! In this edition of the stress test, I've got a quick benchmark running at the start to guesstimate the limits of what your system can handle per-frame, after which it pushes things a little bit harder than that, and grabs the times taken. No drawing functions being tested, in this version. I think I've got a good idea to further optimise drawing calls, but haven't started working on those tweaks yet, so not much point in optimisaling them at the moment. This is 100% for figuring out what JSE's capable of when doing other things. We're testing ifs, gosubs, maths, strings and other base functions to see what's causing any potential slowdowns with the underlying engine, rather than what cool shit it can do on the screen  What to doOpen up Optimisationalism 6 in JSE, and give it a run.It should take about 10 second per run. I'd like you to run it at least 3 times. If you keep your eye on the Benchmark Score on the bottom right when it's finished, you might notice that it's not very stable. In Safari it's CRAZY erratic, whilst in Opera it's stable as a rock. This is the difference between Javascript Compilation times and other such things. Probably best to run it a few times until it seems to settle down. For me using Safari (in the beta, at least) it usually takes about 5 times before all three values are roughly the same. (First time over 3000, second time 300! then it seems to level out over 3000 again) Anyway, run it a few times, make sure it's nice and level'ish, and then hit ; or ' to take the screenshot (or whatever screenshot method your mobile device has. I swear, every time I go to take a screenshot on my Samsung thing, the method's changed to some even more bizarre 12-finger gesture) Post your scores below, and I can hopefully understand a little more about the limitations of the underlying code. Thanks all
-=-=- ''Load, Next List!'' |
| Tue, 02 Sep 2025, 03:56 | |
|
Jayenkai |
 MacOS 26 betaMacbook Air, M2, 8GbSafari : 3150 Firefox : 2150 Opera : 1300 Arc : 1300 iPadOS 26 betaiPad 11 Pro, M4Safari : 4000 iPhone iOS 18iPhone 16Safari : 3200 Samsung Tab10A 2018Chrome : 200Quest 3"Browser" : 200, but smoother-=-=- ''Load, Next List!'' |
| Tue, 02 Sep 2025, 05:11 | |
|
Dan |
 Win 10 : SrWare iron (Chromium) |
| Tue, 02 Sep 2025, 05:33 | |
|
Jayenkai |
Cool. So you're running about twice as fast as the Quest 3 is. That's good to know. I can try to target that as far as general speed goes.
-=-=- ''Load, Next List!'' |
| Tue, 02 Sep 2025, 07:36 | |
Pio
|
 This is on my old computer with GNU/Linux. NVidia graphics card. The browser is LibreWolf (Firefox with some things turned off). |
| Tue, 02 Sep 2025, 14:30 | |
|
spinal |
 Wow, mine looks terrible. Win 11, Chrome, -=-=- Check out my excellent homepage! |
| Tue, 02 Sep 2025, 14:51 | |
|
Jayenkai |
Nah, don't worry, it's fine. The "benchmark" number is related to how many things it then pushes itself to do, per loop, during the main test. Because yours and mine are higher than Pio and Dan's it means the main loop is under a heavier load, so it gives us more damaging stats in the test times. This also means, though, that the differences are much more varied. Pio's is probably the most interesting here, in that there's variations from left to right, whilst the rest of us seem to have rows of averages. In you and me, it's clear that Multi-command and Random String are really bad. Dan seems to show that too, whilst Pio's never really seems to find a groove. I think that's probably the most curious thing, here. -=-=- ''Load, Next List!'' |
|
|
| |||
|
| ||||